

Polk County Utilities
EPIC conducted thorough needs analysis and process mapping, always eager to troubleshoot, provide solutions, and collaborate effectively with all stakeholders.
Seminole County Environmental Services Division
Our partnership with EPIC Engineering & Consulting Group has modernized Seminole County Environmental Services, improving efficiency, data integrity, and project workflows.
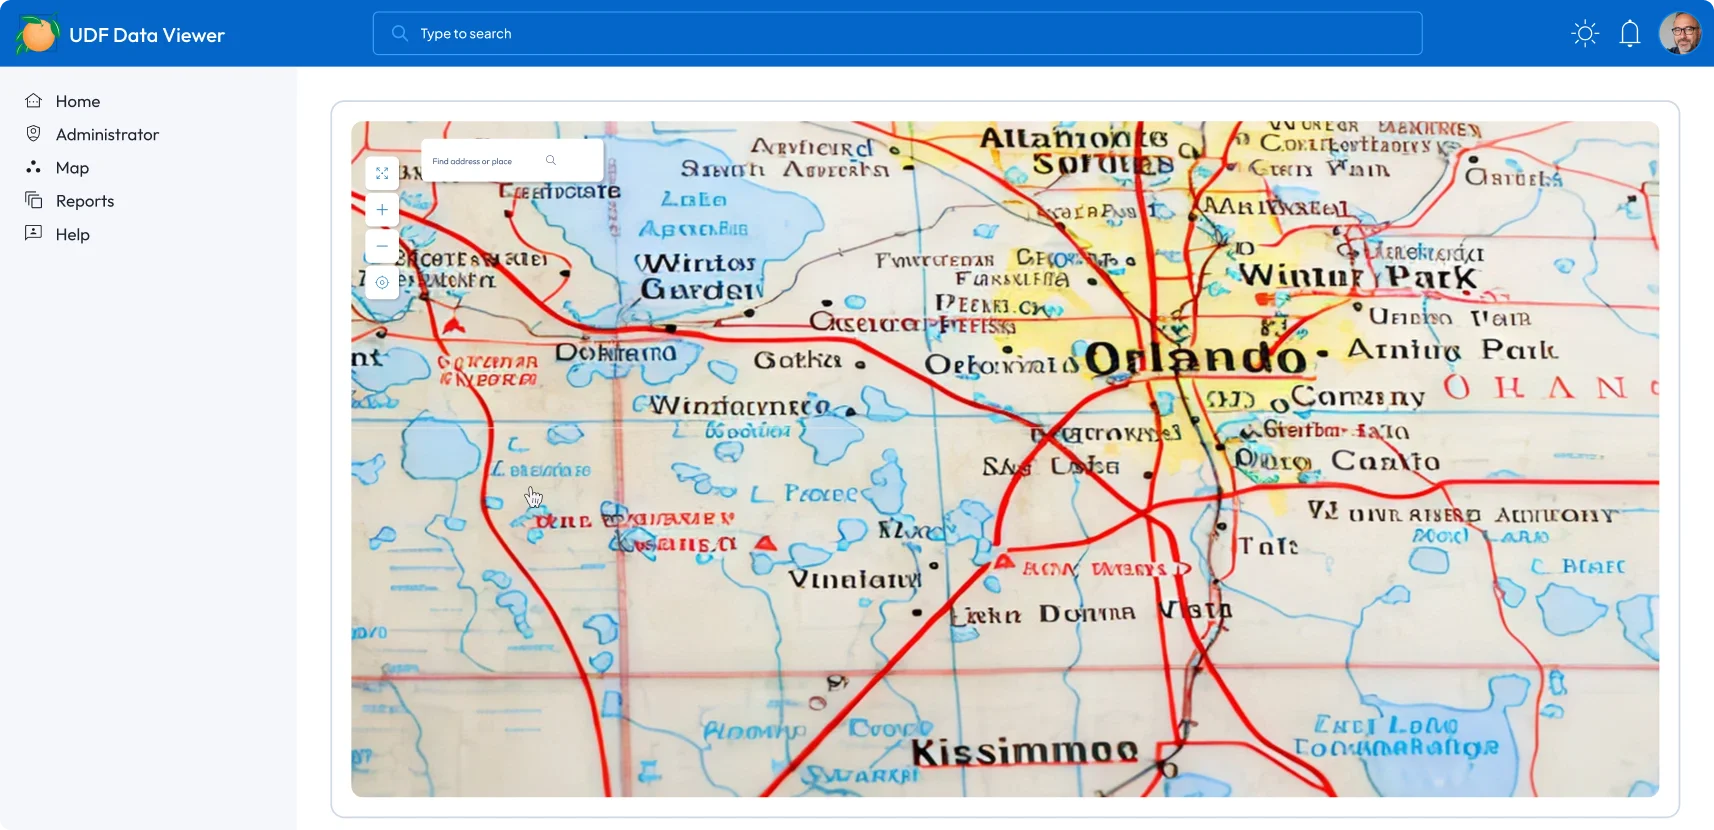
City of Orlando
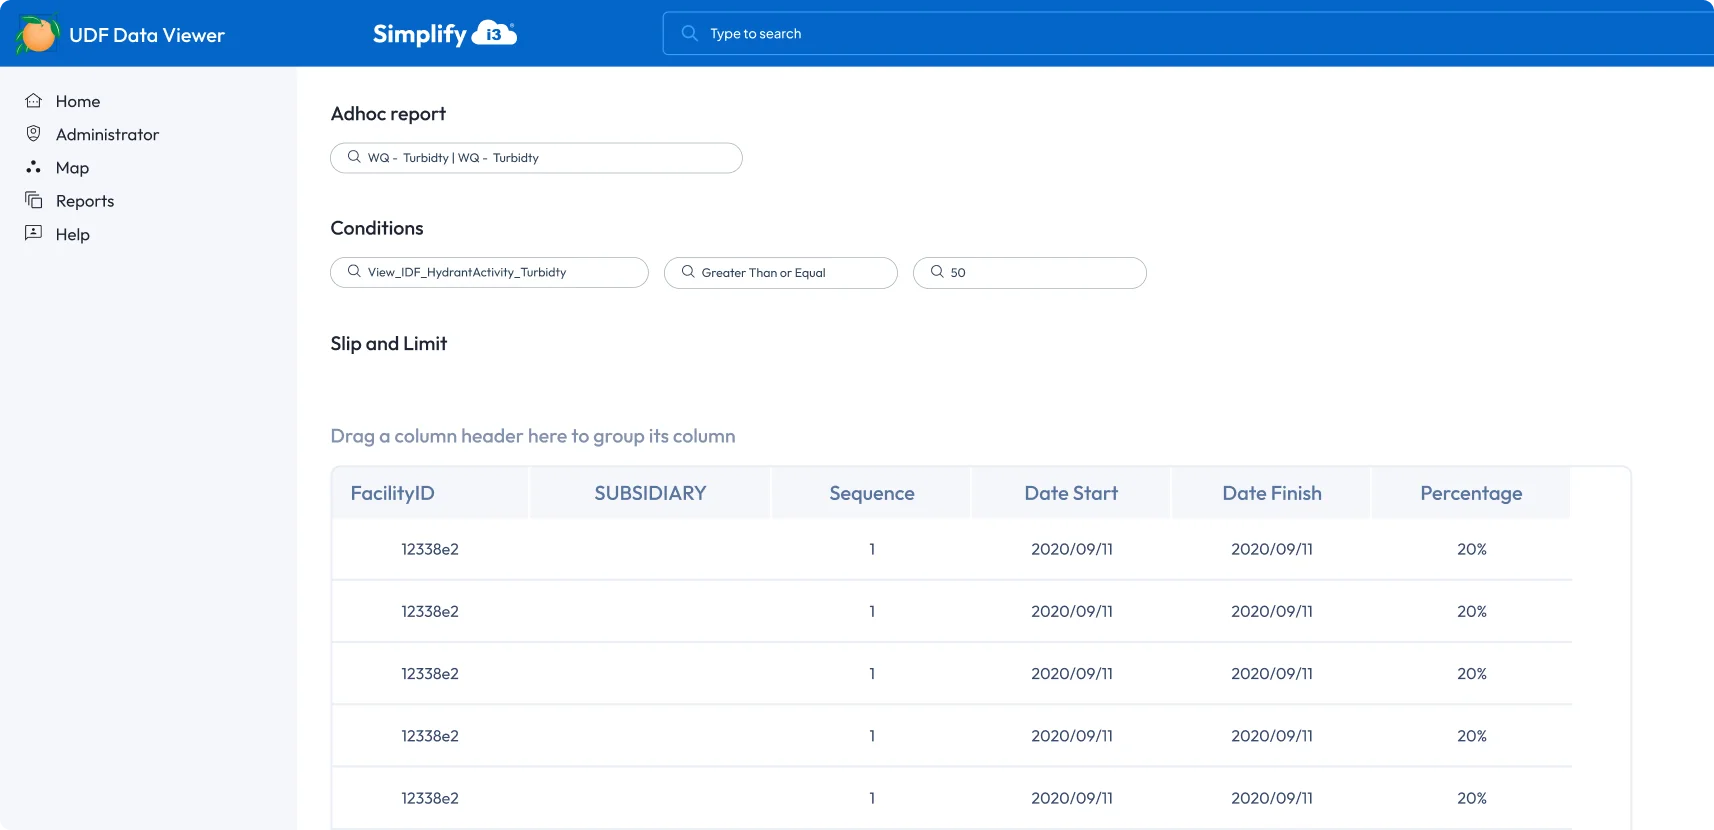
EPIC has been a trusted partner in our digital transformation. With Simplify i3, we eliminated duplicate data, reduced spreadsheets, and streamlined operations in a cloud-based system.